Electrophoresis.R
Molecular Weight Interpolation of Bands
Introduction
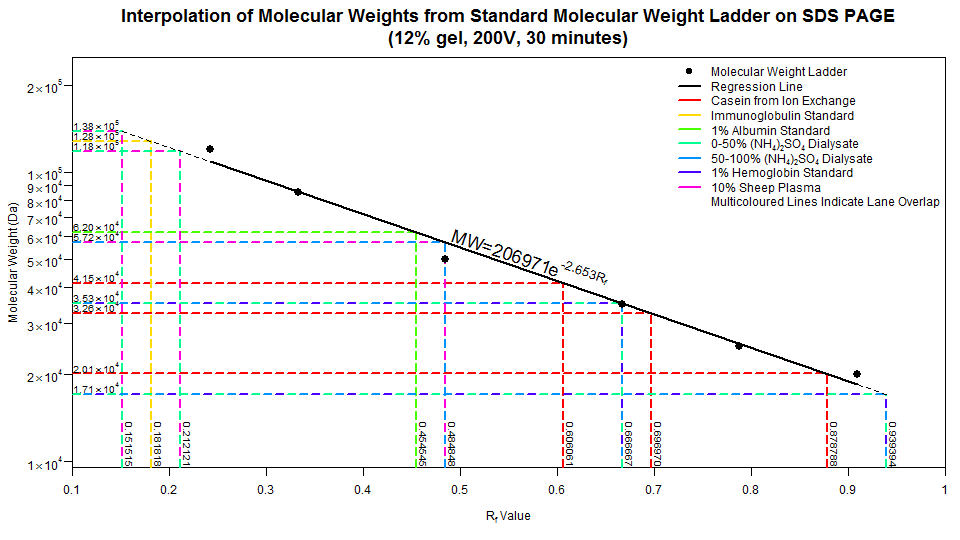
Electrophoresis.R is an R script for quickly compiling the molecular weights of unknown bands from a gel electrophoresis into a presentable figure. It elucidates the exponential regression equation from provided molecular weight ladder data and from this, plots the appropriate interpolated weight for each band. Additionally, bands can be clustered by lanes, allowing for a colourful comparison.
Features
- Simply structured input files for both the molecular ladder and unknown bands.
- Exponential regression of the molecular ladder for interpolation.
- Creation of a paper-presentable figure, with lanes clearly labelled with an appropriate legend.
- Pretty rainbow colour scheme.
Demonstration
Being in a biochemistry major, I was forced to take a basic lab course which introduced elementary lab techniques. Pipetting, buffer concepts, Michaelis-Menten kinetics, PCR, and the (boring) list continues. Their usefulness however is not to be underestimated. The only dreadful component was compiling lab reports, which for me was composed of a whopping 20 pages average. And this had to be done for every unit (five in total). So when it came to labelling interpolation lines in Excel for my figures, I found I have had enough. "Time to whip out my programming knowledge!", I said naively. Pretty sure it longer to write this script, but for those future electrophoresis experiments, it was brain dead to run this.
 |
 |
|---|---|
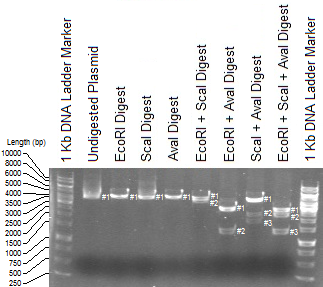
| The (thankfully successful) gel | Resulting figure |
Firstly, take a look at the example input files. The first one, MolecularWeightLadder_RE.csv, is comma separated. Hopefully the header line should be informative enough with Rf first, comma, and molecular weight. The second one, Lanes_RE.txt is somewhat comma delimited. First 'column' is what the lane contains (i.e. an appropriate label), followed by comma separated Rf values. Run the script as follows:
- ./Electrophoresis.R \
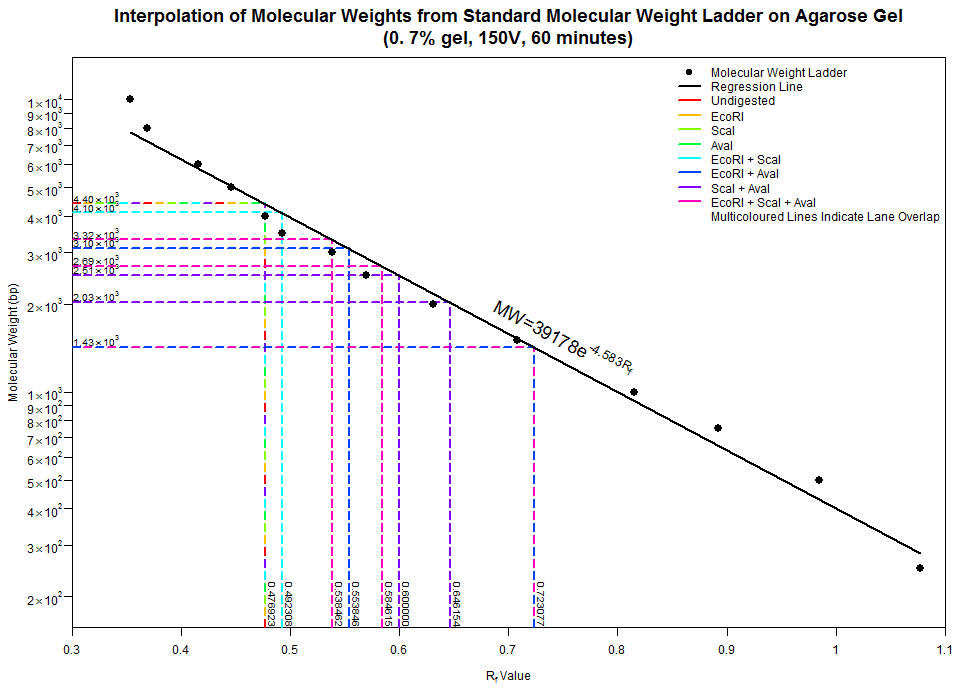
- --main="Interpolation of Molecular Weights from Standard Molecular Weight Ladder on Agarose Gel" \
- --subtitle="(0.7% gel, 150V, 60 minutes)" \
- --y_label="Molecular Weight (bp)" \
- --height=700 \
- --output="Molecular Weight Interpolation RE.png" \
- MolecularWeightLadder_RE.csv \
- Lanes_RE.txt
And presto! Notice that just using one restriction enzyme alone led to the same band, implying that there is either one or no sites to cleave at. This nicely shows up as a multicoloured line in the plot. Some other overlaps occur, such as the dark blue and pink line (EcoRI + AvaI and EcoRI + ScaI + AvaI respectively) at Rf = ~0.72, meaning that this section of DNA was not cleaved by ScaI. If you're observant enough, you'd expect one more band in the EcoRI + ScaI digest (as well as in the triple digest), but this band was so small (and such a small concentration), it couldn't be visualized at ~300bp. Feel free to dig into the script if you don't like some of the graphical parameters. Hopefully I've commented enough to give a rough idea on what to change. Yell at me if need be.